Category Archives: Scientific Inquiry
Eureka! STEM Launch 2018
Putty Drop Experiment
Total Solar Eclipse 8/21/17 – Part 2
Total Solar Eclipse 8/21/17
Aerospace Educators Workshop 2017 – Conclusions
Read the experiment conclusions written by the participants of the Aerospace Educators Workshop 2017.
Eureka! Launch 2017
MCC Experiment Eclipse Practice 6/24/17
Aerospace Educator Workshop – 7/9/16
Eureka! Launch – 6/17/16
Read the story of our UNO-STEM Eureka! Camp 2016:
Watch our video from the high altitude balloon launch here:
https://www.facebook.com/nearspacesci/videos/653534204794331/
MCC Launch – 4/9/16
Read the story of our latest launch here: http://nearspacescience.com/mcc-launch-4916/
Do Space Grand Opening Launch – 11/7/15
See photos from the balloon from our Do Space Grand Opening launch: http://nearspacescience.com/do-space-grand-opening-launch-11715/
Physics Apps on Mobile Devices
I recently published a blog post detailing a few of my favorite astronomy apps appropriate for Introductory Astronomy (ASTRO 101) students. You can read that to see why I use mobile apps in science, why I predominantly look at iOS apps, and my personal criteria for choosing the best apps.
This post outlines some of my favorite physics apps. These would be appropriate for undergraduate physics students (algebra-based or calculus-based).
The most useful app I’ve found for studying mechanics is Vernier’s Video Physics. This can be used for graphing constant speed, accelerated motion, projectile motion, circular motion, and simple harmonic oscillations.
As an example of what the video tracking looks like on the app, I had my twins throw and catch a basketball after school one day. It took less than a minute total to record the following video and that includes two tries. You can save the video with the points marked along with the graphs to share with others.
What makes this app particularly impressive is letting students analyze their personal videos: their friends and family, their dog, their car. This personalizing of data encourages ownership of the science and understanding of kinematics.
For studying sound, there are many good apps for emitting specific tones, like ToneGenerator. It is a very simple program with a slider bar for changing the frequency of the tone. If you have two different devices, you can set them at slightly different tones to demonstrate beats.
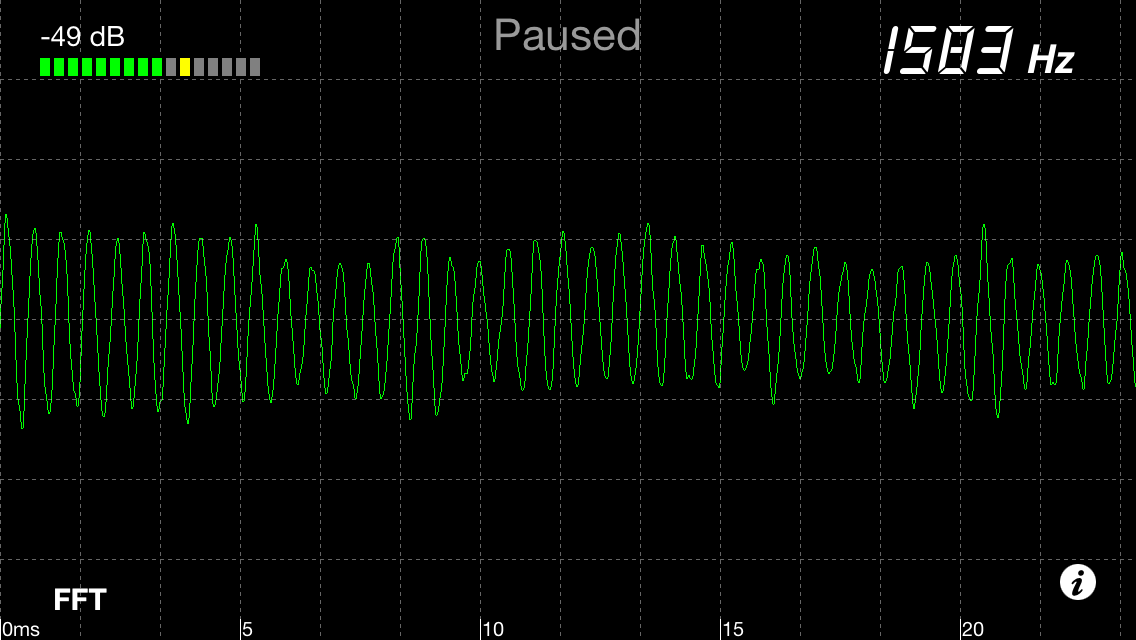
For analyzing frequencies of different sounds, I like FreqCounter. It has a simple interface and the microphone automatically records and shows the waveform. This screenshot captured when I whistled a simple tone and it identified the dominant frequency as 1583 Hz. You can pause the waveform by tapping anywhere on the screen.
I developed an inquiry-based lab to have students successfully explore resonant tones of different levels of fluid in water bottles using this app.
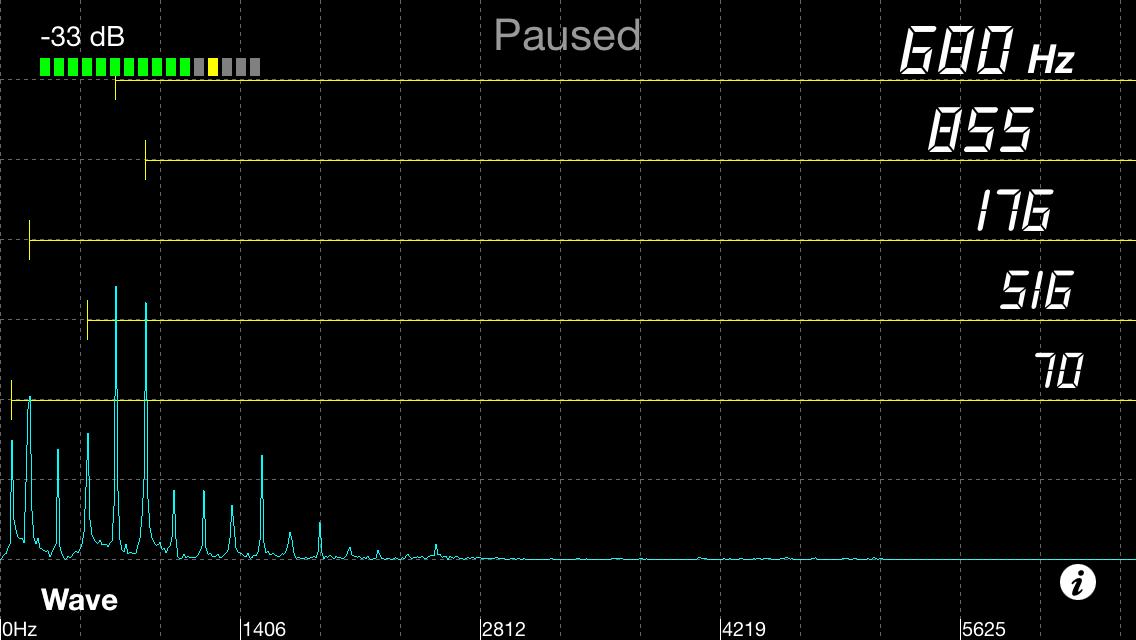
If you tap the FFT in the bottom left-hand corner, it takes you to the Fast Fourier Transform which shows a frequency spectrum and lists the top five loudest frequencies. This next image shows the frequency spectrum when a note was sung. There are many possibilities for studying the frequencies of different musical instruments and other sounds.
As a seismometer, this app accesses the x-y-z accelerometer sensors in the mobile device to measure small vibrations.
After showing this to Al Cox, a colleague of mine in our college iPad group who teaches automotive, he was able to use it to isolate the frequency of a vibration from a car that his class was examining and identify what part caused that rotation rate.
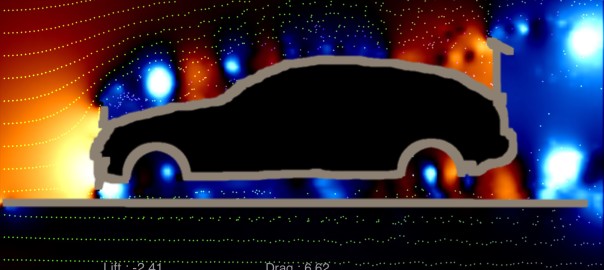
For sheer beauty and as a demonstration of the computing power of mobile devices, Wind Tunnel is a wonderful app. A few decades ago, it would take supercomputers a long time to perform calculations of fluid dynamics that showed these kinds of swirling vortices which would equate to a tremendous amount of money. With this app on my mobile device, I am able to change the parameters of those calculations while the fluid is in motion with the swipe of my finger.
The following video shows some of the features that Wind Tunnel provides. It begins with individual particles in streamline motion with my creating disturbances by touching the screen. You can change the flow to smoke (which is utterly hypnotic to watch) or a color pressure map or speed map over top of the particle motion. You can select a number of barriers to the fluid, such as rocks in a stream, a car or an airfoil in air, or you can draw your own walls to create impediments.
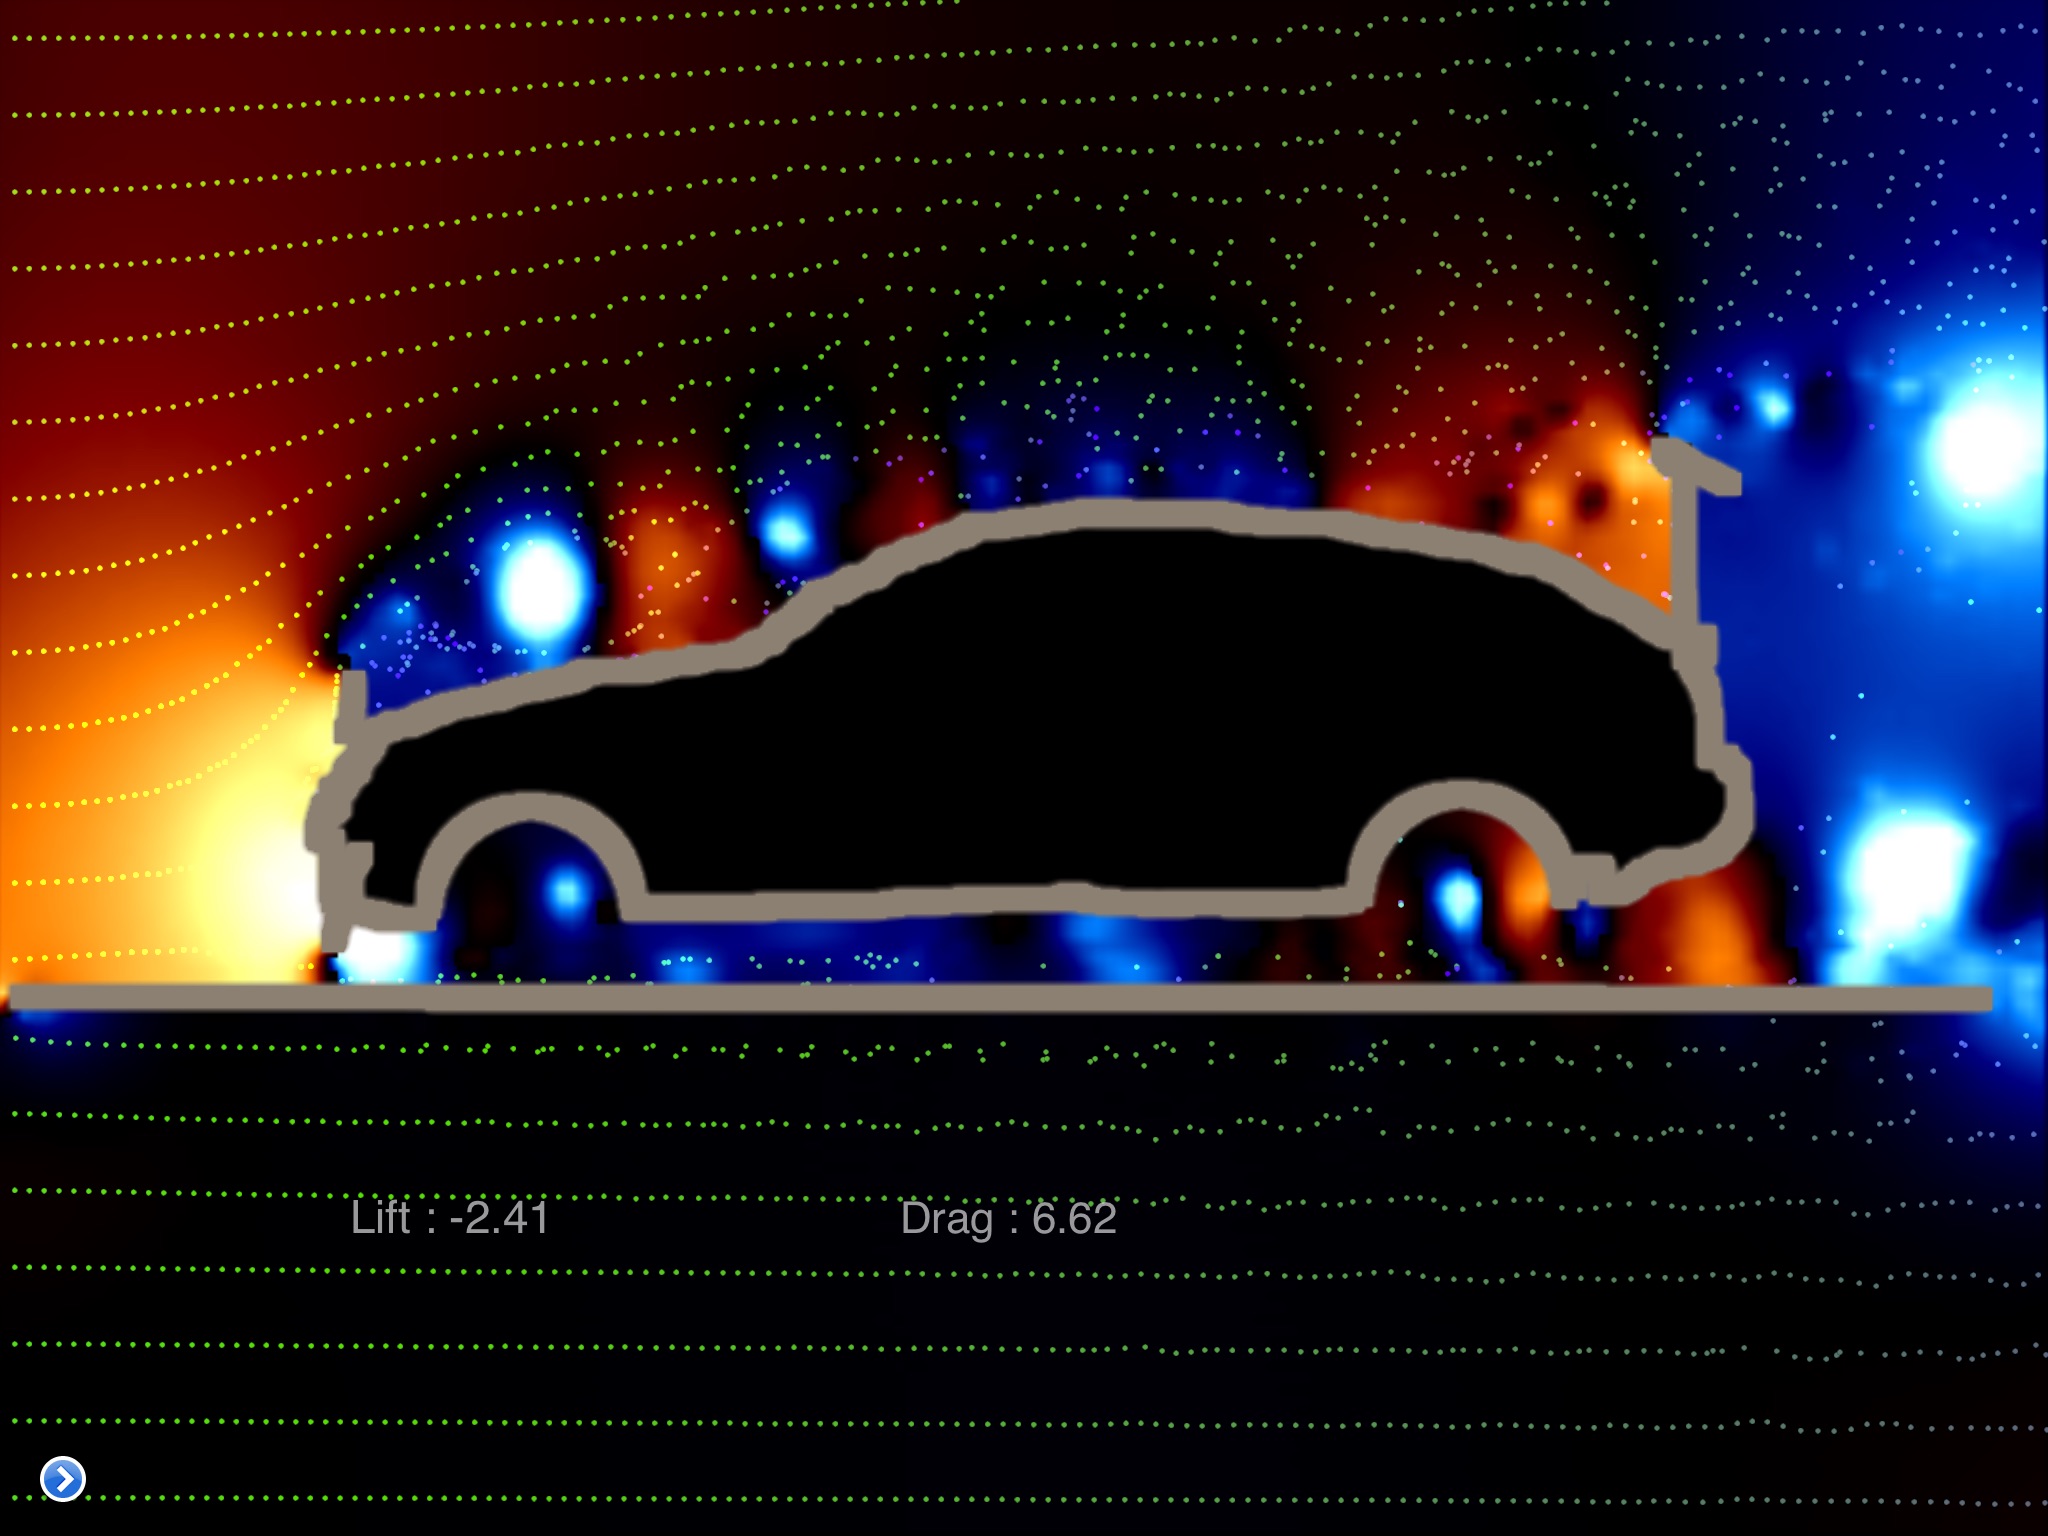
This works the best as a dramatic visual demonstration of fluid motion. It uses the Navier-Stokes equations for flow velocity (based on cell units) and can calculate the lift and drag on an object.
I used the draw tool to put spoilers on a car. Note the difference between the lift and drag in the two situations. After showing this as a demonstration, I talk to students about why their gas mileage might go down after making these kinds of modifications to their vehicles.
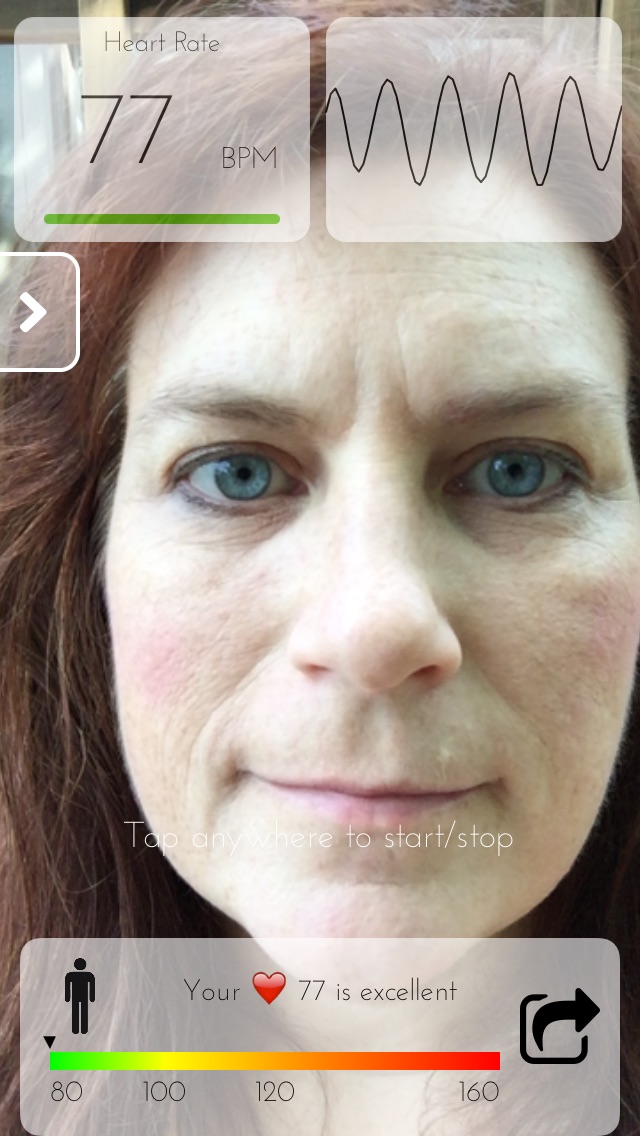
This is a health app that uses your camera to determine your heart rate – it does not use vibrations. It uses the image to amplify and measure the small variations in the color of your face as blood flows under your skin during each heart beat.
If I jog around a bit and remeasure, I can see an increase in my heart rate. This app is especially cool because it is one step closer to turning our phones into medical scanners from Star Trek.
Astronomy Apps on Mobile Devices
We love our mobile devices. A cell phone can be a digital Swiss army knife: a single multi-tool that replaces so many other devices. In addition to being able to text, email, watch videos, listen to music, and surf the web, it can replace a watch, a timer, a calculator, a calendar, a camera, a flashlight, a weather radio, a coupon carrier, a map, a pedometer, a GPS locator, and more.
I often think about how I can get my students to learn about science, to think about science, to do science with the tools they have. I am especially keen on using the sensors that already exist in smart phones to take scientific data, such as the accelerometers for analyzing motion, the camera for light intensity and video for motion analysis, the microphone to determine the frequency of sounds, and the magnetic field sensor.
When I am reviewing apps, I am generally looking for those that have educational and scientific value, are intuitively obvious to use, and are relatively inexpensive ($10 or less, preferably free). As a member of a pilot iPad group at my college to explore ways to have students use iPads for educational purposes and as an iPhone owner, the apps I’ve used are predominantly iOS-based. For my students who only use Android products, I ask them to look for comparable apps or web-based applications, but if none are available, we have some iPads available at the college for checkout with the pertinent apps already loaded.
I teach introductory astronomy and thought I would share some of my favorite apps for getting students, especially those in online classes, to use their mobile devices to access current astronomical data, to take astronomical data, and to share that data with others.
Before talking about apps for students to use, a conversation about astronomy apps would not be complete without discussing the classic handheld planetarium software. Everyone has their favorite and there are many very good free and inexpensive ones, but our favorite for use at star parties is the Sky Safari 4 Pro. Not only is it an excellent app but it allows us to wirelessly control our telescope from a mobile device via Orion’s StarSeek wifi control module.
The Exoplanet app designers have created an amazing little piece of software. It updates the number of confirmed exoplanets and all of their known characteristics daily. Every time that a news article is released with new information on an exoplanet, you can look it up in the database and see an animation of its orbit and light curve with a just few taps on the screen. It allows you to easily do correlation plots and see if there are interesting relationships between those characteristics. It plots the exoplanets on a 3-dimensional map of the Milky Way Galaxy and it uses the GPS coordinates from your phone to locate your position and see a view of them in the night sky from your perspective. I have recorded a short video while running Exoplanet on the iPad showing some of the features.
Having so much new data on exoplanets and the power to personalize it and manipulate that information visually is very powerful. Letting students know that they have access to all of this detailed information as soon as it is available is even more powerful.
Solar Monitor and SpaceWx
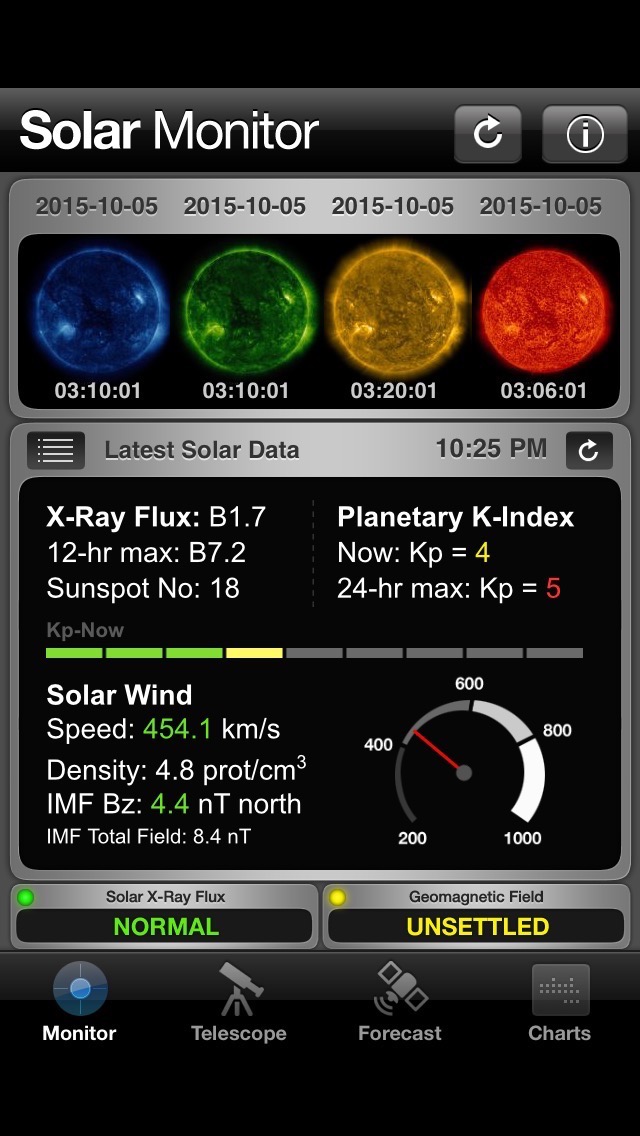
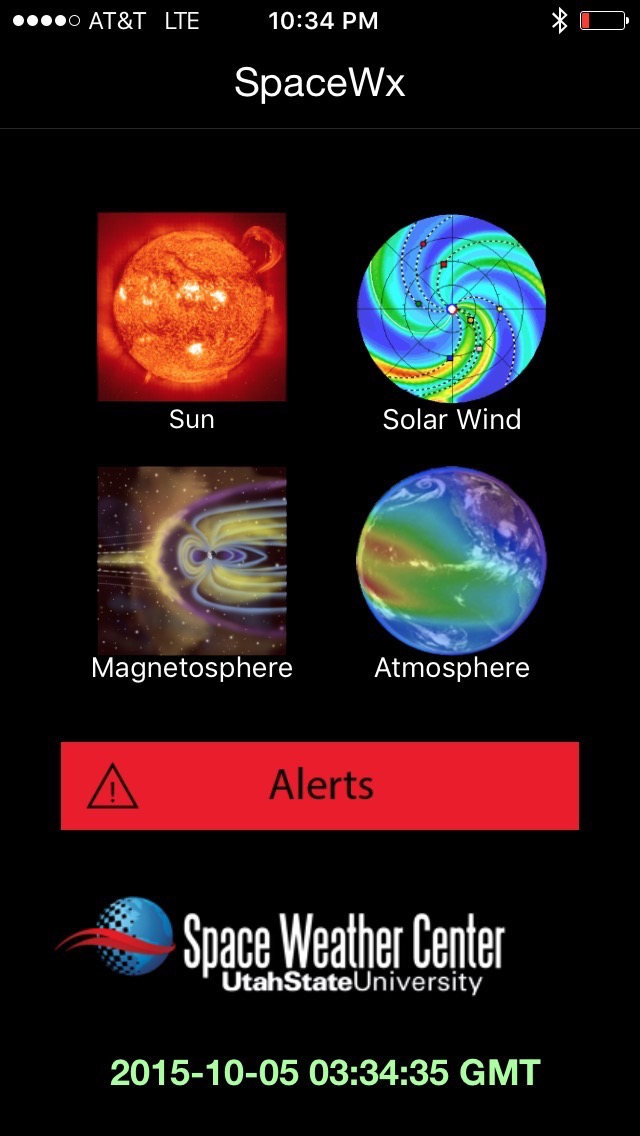
For accessing images of the sun as well as other important space weather data on your phone via mobile app, I like Solar Monitor or SpaceWx. Just like the Exoplanet app, the reason that I find these so amazing is the speed at which we can access the data. I tell my students to stop and think for a moment about viewing the sun. If they wanted to physically look and see sunspots or other features, they would likely go outside and set up a solar telescope (if the weather was clear and if it was daylight). Using the apps, I can access data from the sun taken from satellites IN SPACE that are sending down images of different wavelengths, as well as magnetograms, x-ray flux, and other space weather information, WITHIN MINUTES of being taken! I try to press the point that they are seeing these about as quickly as any solar scientist on Earth and it can be daytime or night, regardless of the weather. Both of these apps can provide alerts for strong solar activity, which could be a good precursor to having students (or the general public if you are doing outreach) for solar viewing using a visible-light filter or hydrogen-alpha telescope.
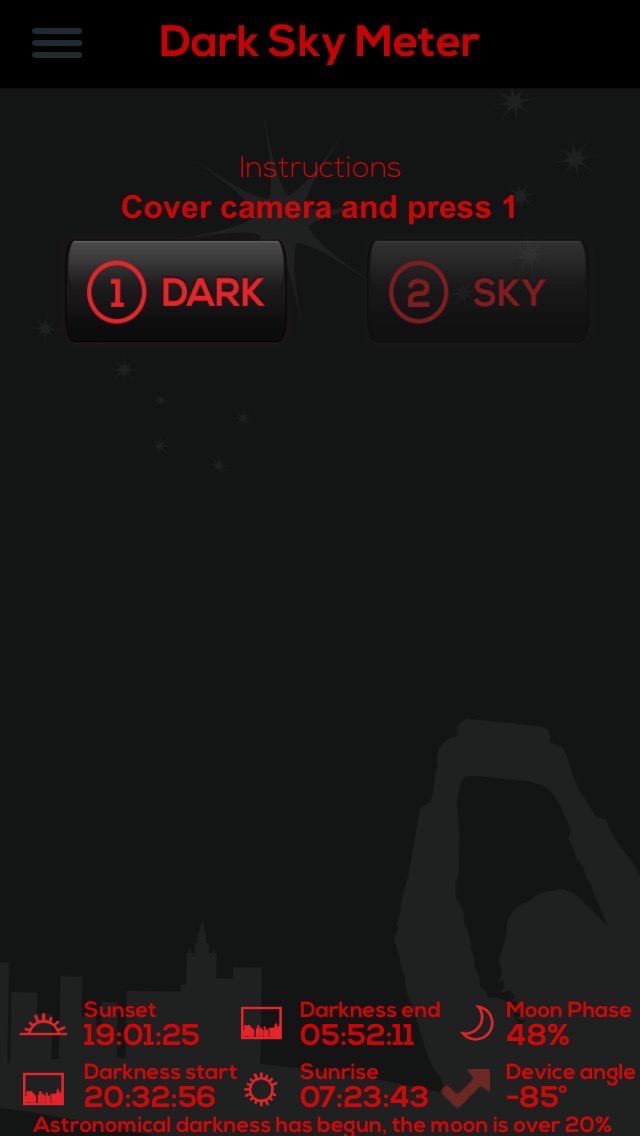
This app allows the user to take measurements of the brightness of the night sky using the camera and you can submit your measurements to the International Dark Sky Association to be included in their map.
This is an example of citizen science, crowd-sourcing data taking by non-professional astronomers. It is an easy way to get students to participate in a night sky activity, to feel a part of a larger scientific study, and to begin a discussion of light pollution, get a sense for what it means for astronomical observing near their home, and talk about how to possibly mitigate it.
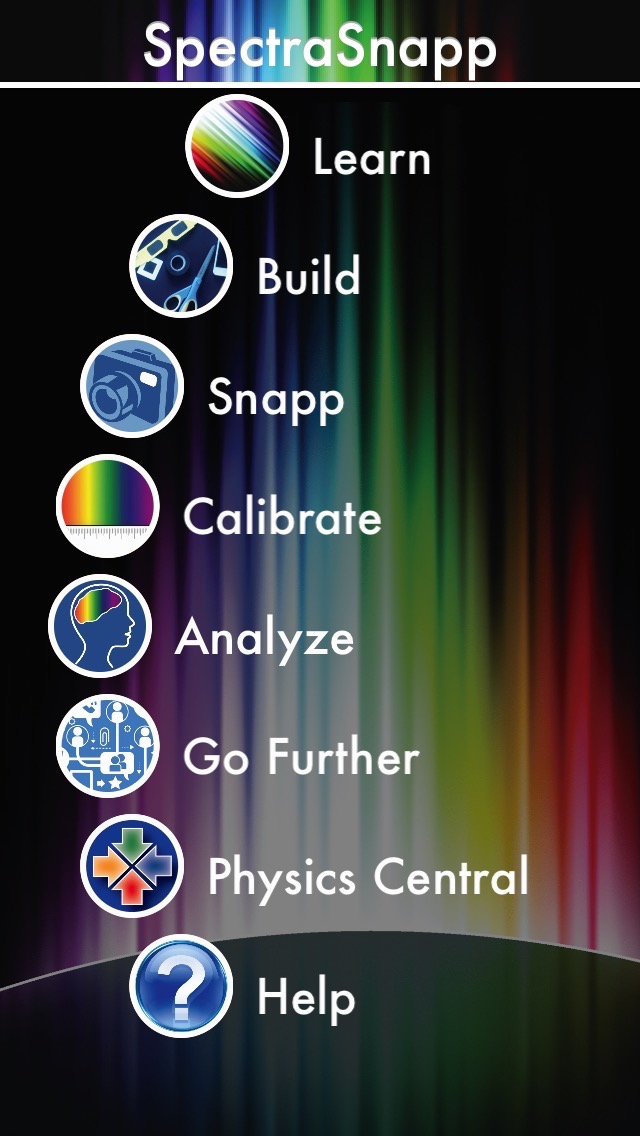
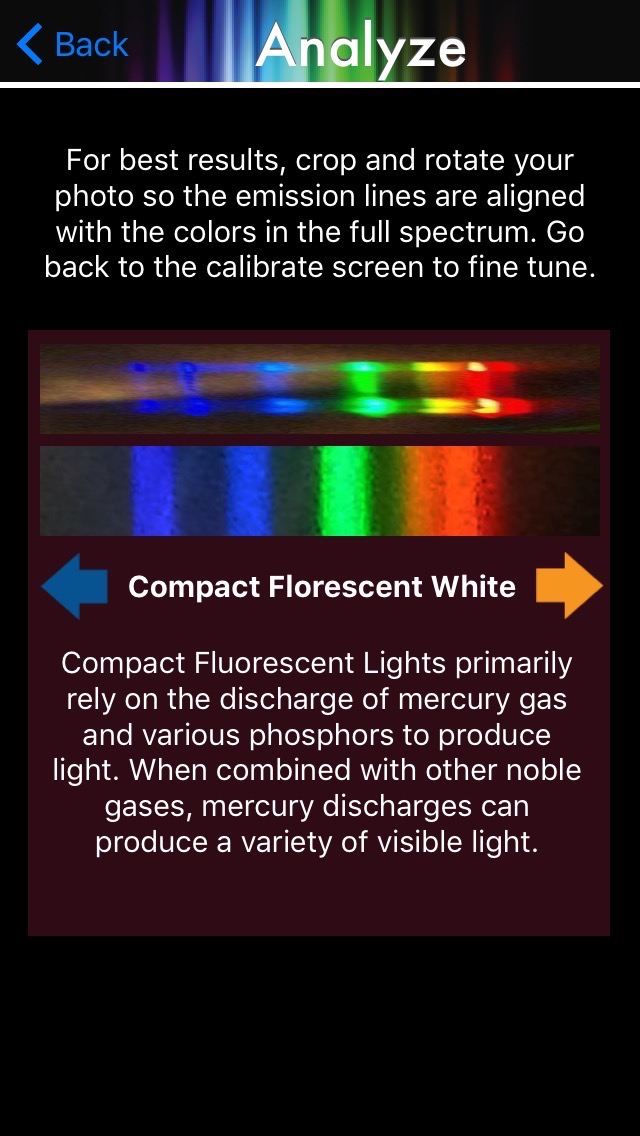
A group from the American Physical Society (APS) has created an app that allows you to turn your cell phone into a DIY Spectrometer.
It requires a small piece of plastic diffraction grating material. I send my online astronomy laboratory students diffraction grating glasses from Rainbow Symphony. All you have to do is tape a small piece of the diffraction grating in front of the camera lens and create a tube with a small slit in the end to minimize the amount of light that enters. Students can learn about spectra but are also able to take a photo of the spectra of different light sources and share those images with me and the other people in the class.
Several years ago, I wrote an article for the Astronomy Education Review on Catching Cosmic Rays using DSLR Cameras. At the time, I did not have the capability to change the time of exposure for my cell phone camera, but I was able to do so with my DSLR camera using a bulb timer mechanism. This week, I found an app that I can use to take long interval exposures with the iPhone camera and was able to capture some cosmic ray hits.
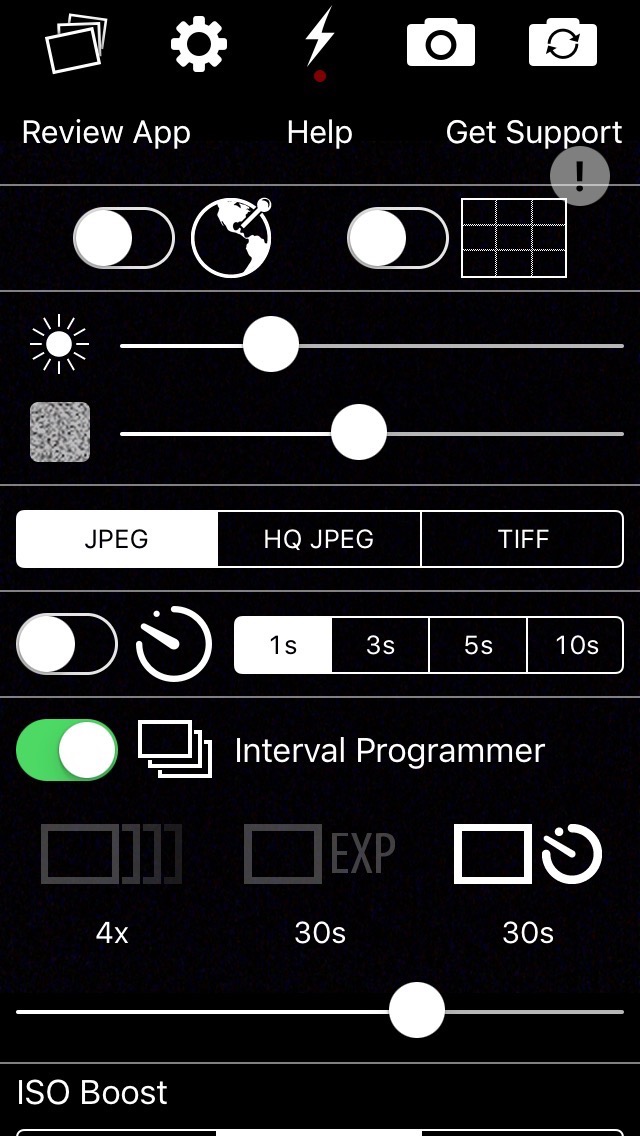
We were originally looking at this app to improve images in low-light (for star party / telescope observing sessions) and to be able to take better images using the cell phones through binoculars and telescopes. My husband, Michael, found a cell phone mounting bracket and we plan to use it for our upcoming star party with a telescope solely devoted to guests who want to use their own phones to take pictures through it, a more common occurrence these days. In addition to the ISO Boost for enhancing low-light images, the interval programmer portion of this app will allow the user to effectively “leave the shutter open” to take pictures of star trails.
The rate of cosmic ray hits at sea level is approximately one count per square centimeter per minute. When I look up the area of the CMOS sensor on my iPhone, it is a little less than 1/3 of a square centimeter, but I am higher than sea level (at about 1000 ft.) so I would expect to get one good hit for every few minutes worth of exposure.
I covered my phone’s camera lens with a pillow and took some extended exposure shots. After playing around with the settings, I found that if I took too long of exposures at too high of ISO, the dark current overexposes the image and it is hard to pinpoint any cosmic ray hits. If I took too short of an exposure, it gives a nice, dark background, but rarely has any bright dots or streaks.
It is pretty easy on the phone to zoom in and scan the dark image for white dots or streaks. This is a zoomed-in look at a cosmic ray hit.
There is a group working on a project called CRAYFIS (Cosmic Rays Found in Smartphones), a citizen science app to use cell phones as a cosmic ray array, but I think that it is taking them longer than expected to release beyond the limited beta testing. In any case, it is very cool to be able to perform a high-energy particle physics experiment using my own phone.
HALON NorthStar Launch – 6/30/15
Read the story and see photos of the HALON NorthStar Launch here:
http://nearspacescience.com/halon-northstar-launch-73015/
EUREKA! – STEM launch 6/18/15
Read the story and see the photos from our EUREKA! – STEM flight here: http://nearspacescience.com/eureka-stem-camp-launch-61815/
CALHE Launch – 4/17/15
Read the story and see pictures from the CALHE Launch – 4/17/15: http://nearspacescience.com/calhe-launch-41715/
HALON Launch – 4/14/15
Read the story and see photos of the HALON launch: http://nearspacescience.com/halon-launch-41415/
MCC Launch 3/28/15
Read the story of our MCC launch from 3/28/15: http://nearspacescience.com/launches/mcc-launch-32815/
Data from First Near Space Adventure
Check out our data from the the first Near Space Adventure flight here: http://nearspacescience.com/data-near-space-adventure/
Early Undergraduate Research at Two-Year Colleges
My article on early undergraduate research at two-year colleges is featured in the November issue of The Physics Teacher.
http://tpt.aapt.org/resource/1/phteah/v51/i8/p476_s1?isAuthorized=no
“Two-year college (TYC) physics teachers are not often required to provide student research experiences as a part of their contracted duties. However, some TYC physics faculty members are interested in developing research opportunities for their freshman- and sophomore-level students, often called “early undergraduate research” (EUR). Here are some suggestions if you are interested in developing and managing EUR at your TYC.”
Welcome to Near Space Science!
The Nebraska High-Altitude Ballooning (N-HAB) project began in 2011 with our first launch through a workshop hosted by Metropolitan Community College and NASA Nebraska Space Grant. Since that time, we have been a part of dozens of high-altitude balloon launches in the state.
This blog was created to have a journal of our flights, a repository of ballooning data and images for teachers and students to use, and a place to discuss techniques for facilitating scientific inquiry.
