If you want to read the story of this launch, you can do so here: http://nearspacescience.com/launches/mcc-launch-32815/
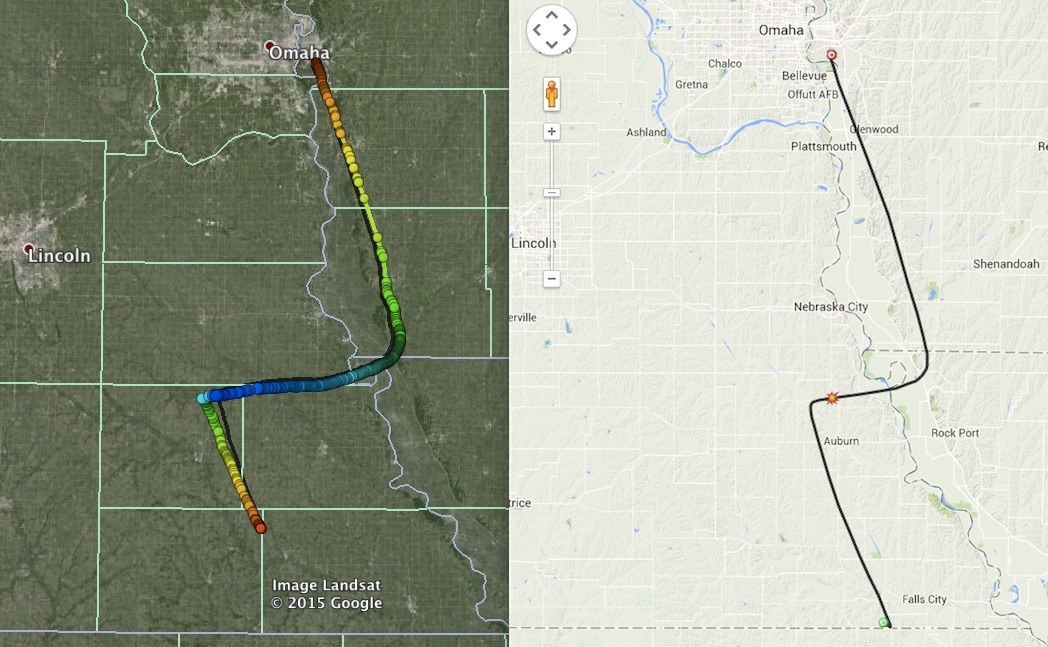
I put the actual GPS data as viewed from above side-by-side with the prediction so you can make a comparison. The prediction was set to burst at 85,000 ft. and, since we used a larger balloon than we usually do, it rose to 103,000 ft instead. So, that middle leg was a little longer than predicted and it came down a little shorter than predicted. However, the similarity is unmistakeable.
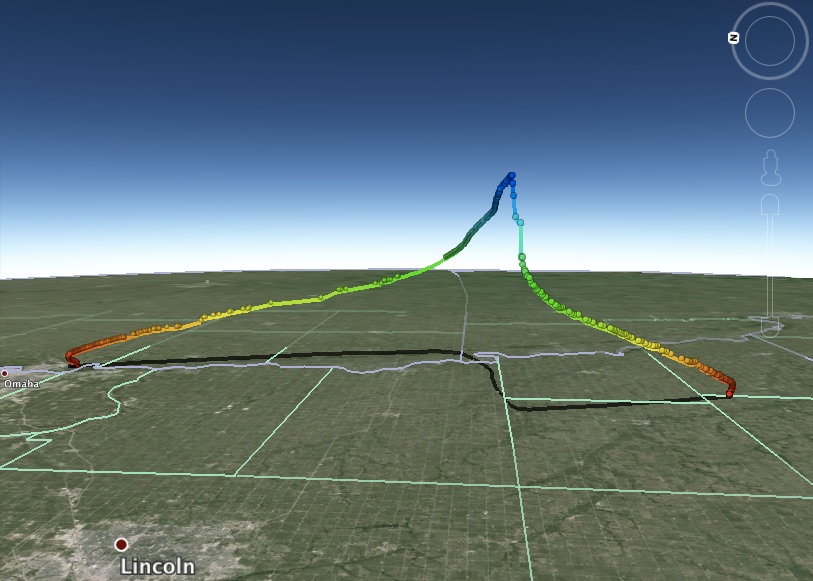
This screenshot from the Google Earth file is looking toward the east.
This screenshot is looking toward the north.

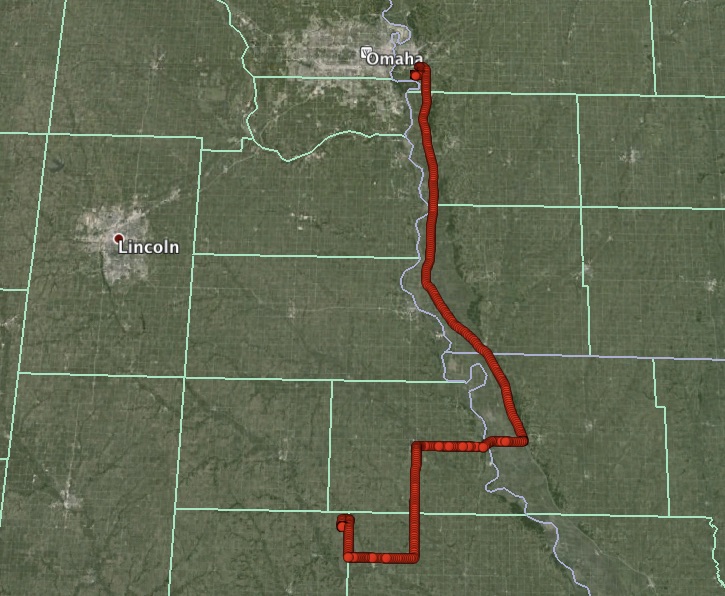
For the first time, we were able to track both the balloon and the chase vehicle on the same map which was wonderful for triangulating the landing during the chase. This is the path that the payload recovery vehicle took.
The following are graphs of data from the command module.
Pressure in psi vs. altitude in ft.

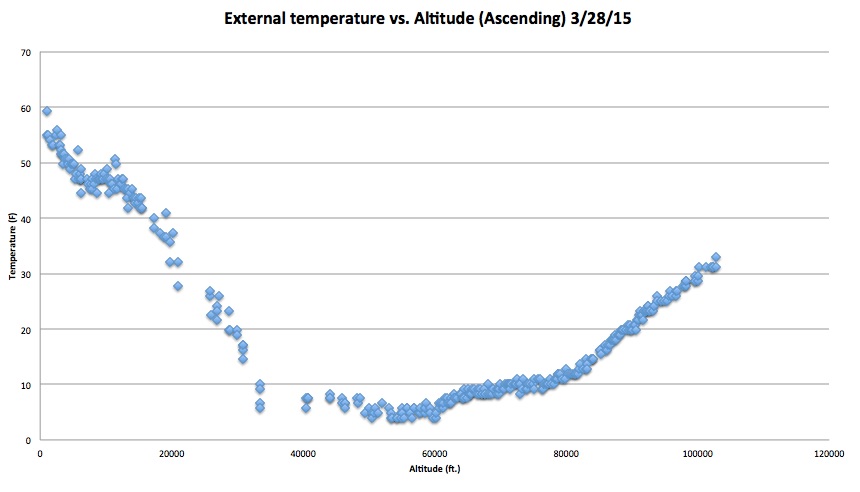
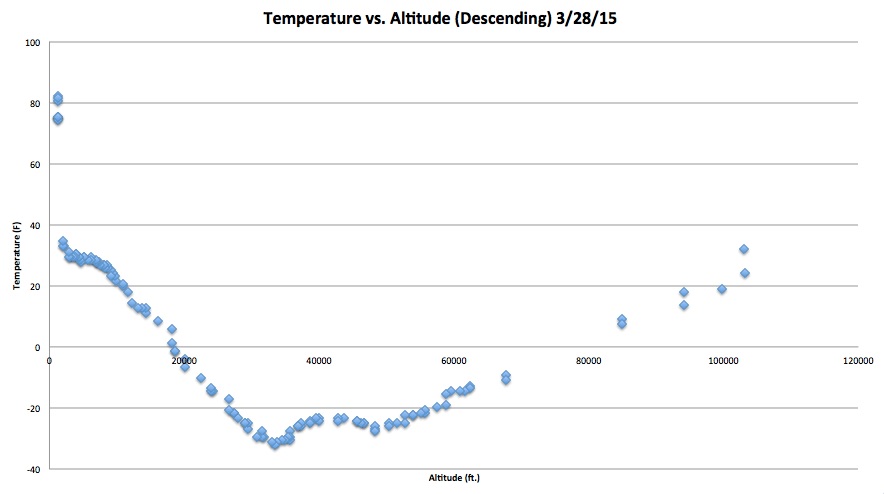
External temperature in degrees F vs. Altitude in ft. on the way up. Interestingly, the temperature did not get lower than 0 F.
However, on the way down, it lowered to around -30 F. Read this graph from right to left as it descended. There are relatively few points from 100,000 to 60,000 ft. because it dropped very quickly as it was going through post-burst chaos.
Speed in miles/hour vs. Altitude in ft. shows that it went almost 120 miles/hour for a short time while in the jet stream. It was traveling 60 miles/hour when it was at 100,000 ft. This is interesting because there is very little pressure at that height. 
Humidity in RH % vs. Altitude in ft. The drop around 10,000 ft. and subsequent increase are at around 17,000 ft. perhaps showing the cloud layers. 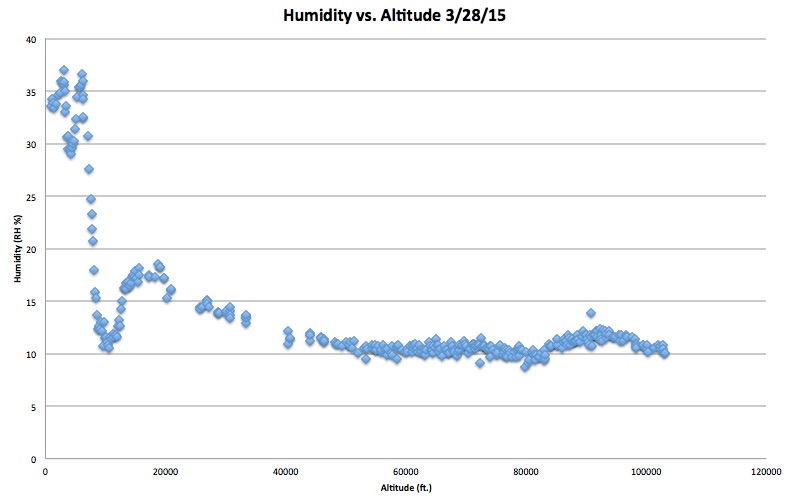
This video shows the expansion of the balloon as it rose through the atmosphere. Each image was taken approximately every 10 minutes. The first photo was taken at launch and the last is at about 103,000 ft. From the images, can you calculate how much the volume increased from the beginning of the flight to the burst?
You can assume the balloon is approximately spherical (Equation for the volume of a sphere is V = 4/3*pi*r^3). On the ground the balloon was approximately 6 1/2 feet in diameter. The pressure on the ground is about 1 atmosphere (14.5 psi) and almost a vacuum (0.1 psi) at the burst.